Fluxor Tables — Excel and Revit: import, sync and export
What it does
Fluxor Tables connects Revit tables to Excel, in both directions:
- Import — the spreadsheet shows up in the preview just like in Excel; you drag the region and it becomes a table in the project, with colors, merged cells, borders and logo.
- Sync — did the spreadsheet change? One click updates the table you imported, without redoing anything.
- Export — the project's tables, including panel schedules, become sheets in a formatted .xlsx file. You choose how many files and what goes in each one.
Scenario used in this article
An electrical project and the Fluxor Tables Exemplo.xlsx spreadsheet, with the Quantitativo do modelo - Fluxor MEP table on the Quantitativo sheet.
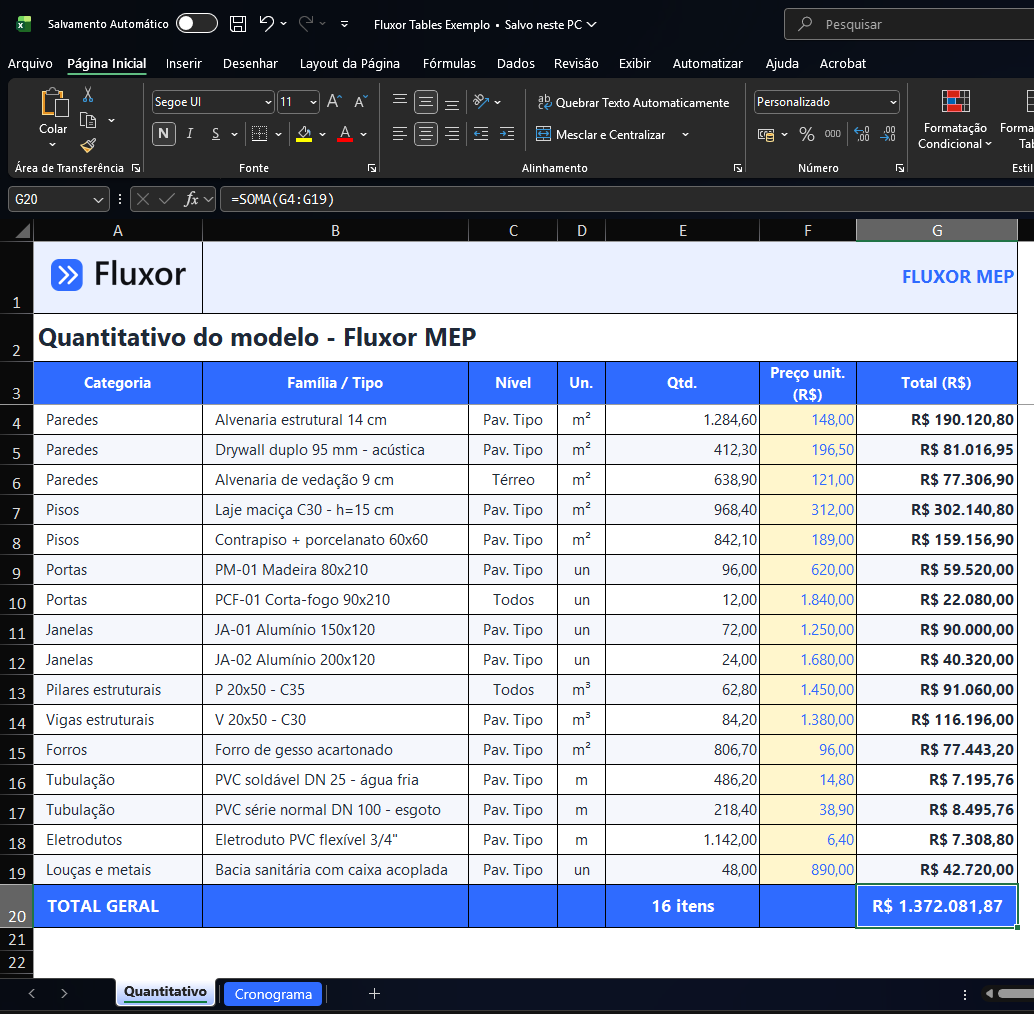
Part 1 — Import the spreadsheet into Revit
- Open the tool and choose the spreadsheet. On the Fluxor ribbon, Productivity panel, click Fluxor Tables. The window opens in 1 · Import (Excel → Revit). Click Choose spreadsheet… and select the .xlsx.
- Check the preview. The sheet shows up in the center just like in Excel. At the bottom of the preview are the file's sheets — click to switch. Ctrl + mouse wheel zooms.
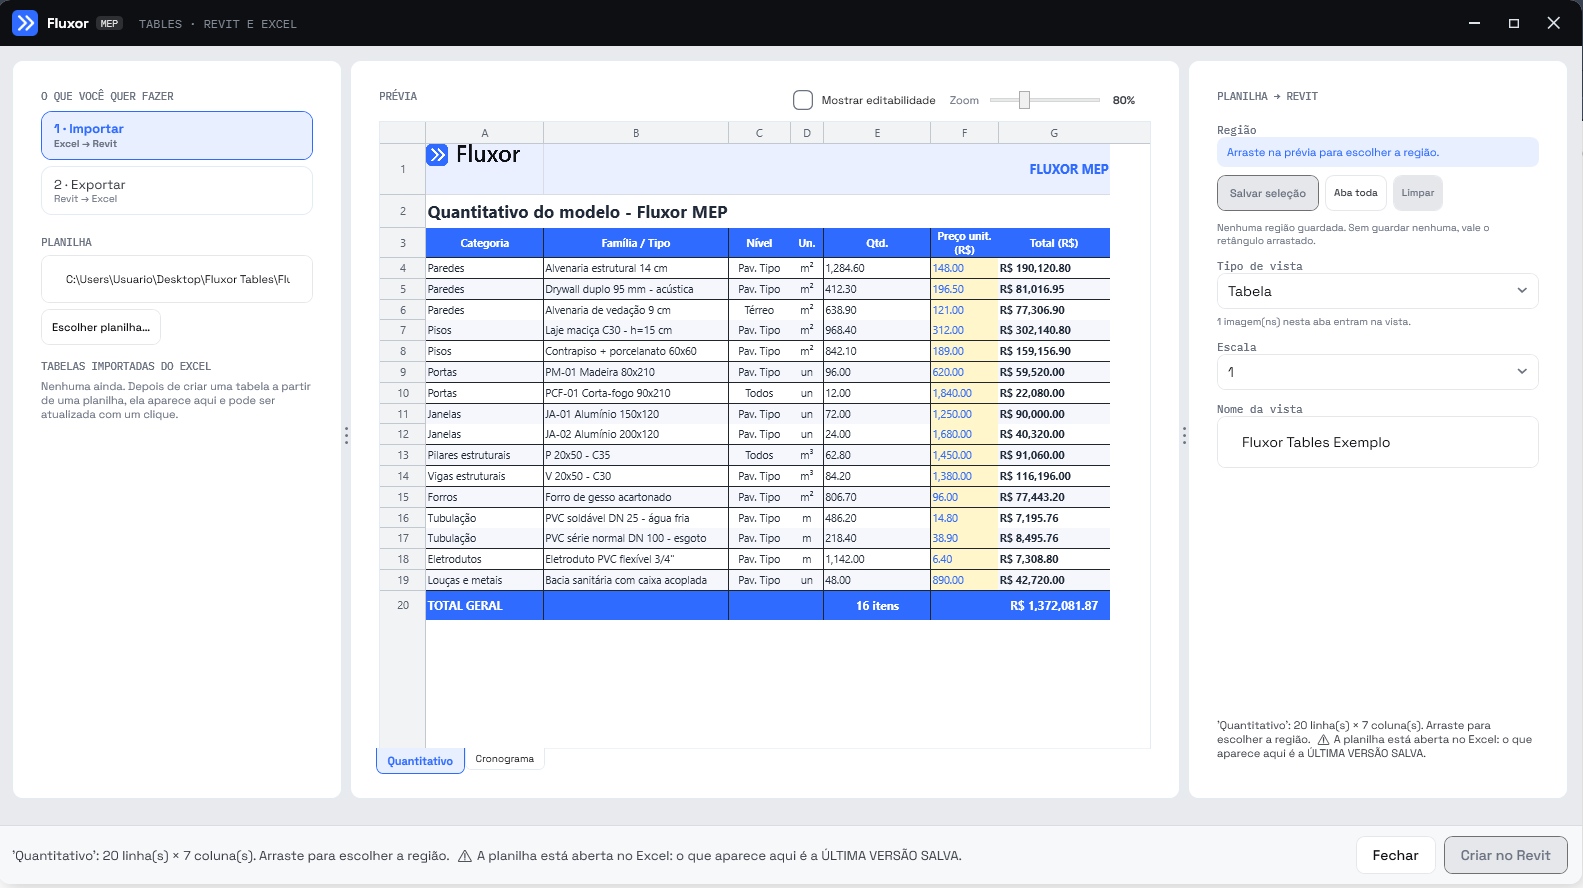
- Drag the region and save it. Click the first cell of the table and drag to the last one. On the right, under Region, the address shows up — here, A1:G20 (20 × 7). Click Save selection. To import the whole sheet without dragging, use Whole sheet.
Want more than one table? Drag and save each region, even from different sheets: each one becomes a view.
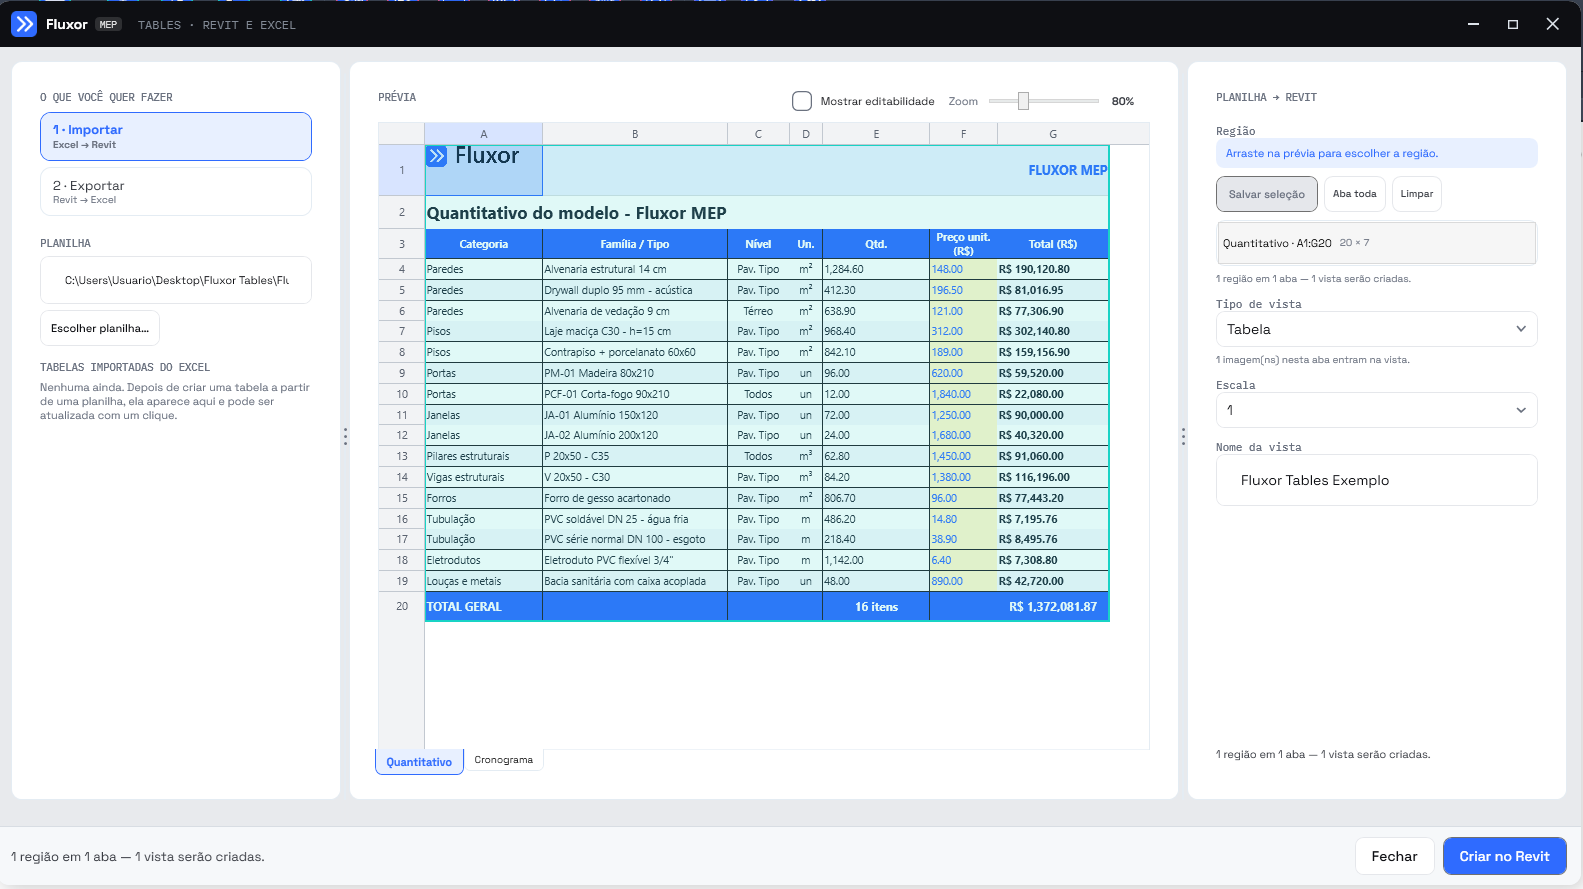
- Create it in Revit. Check the View type (Table is the default) and View name, and click Create in Revit. The table is created and opened on screen. Don't like it? Ctrl+Z undoes all of it at once.
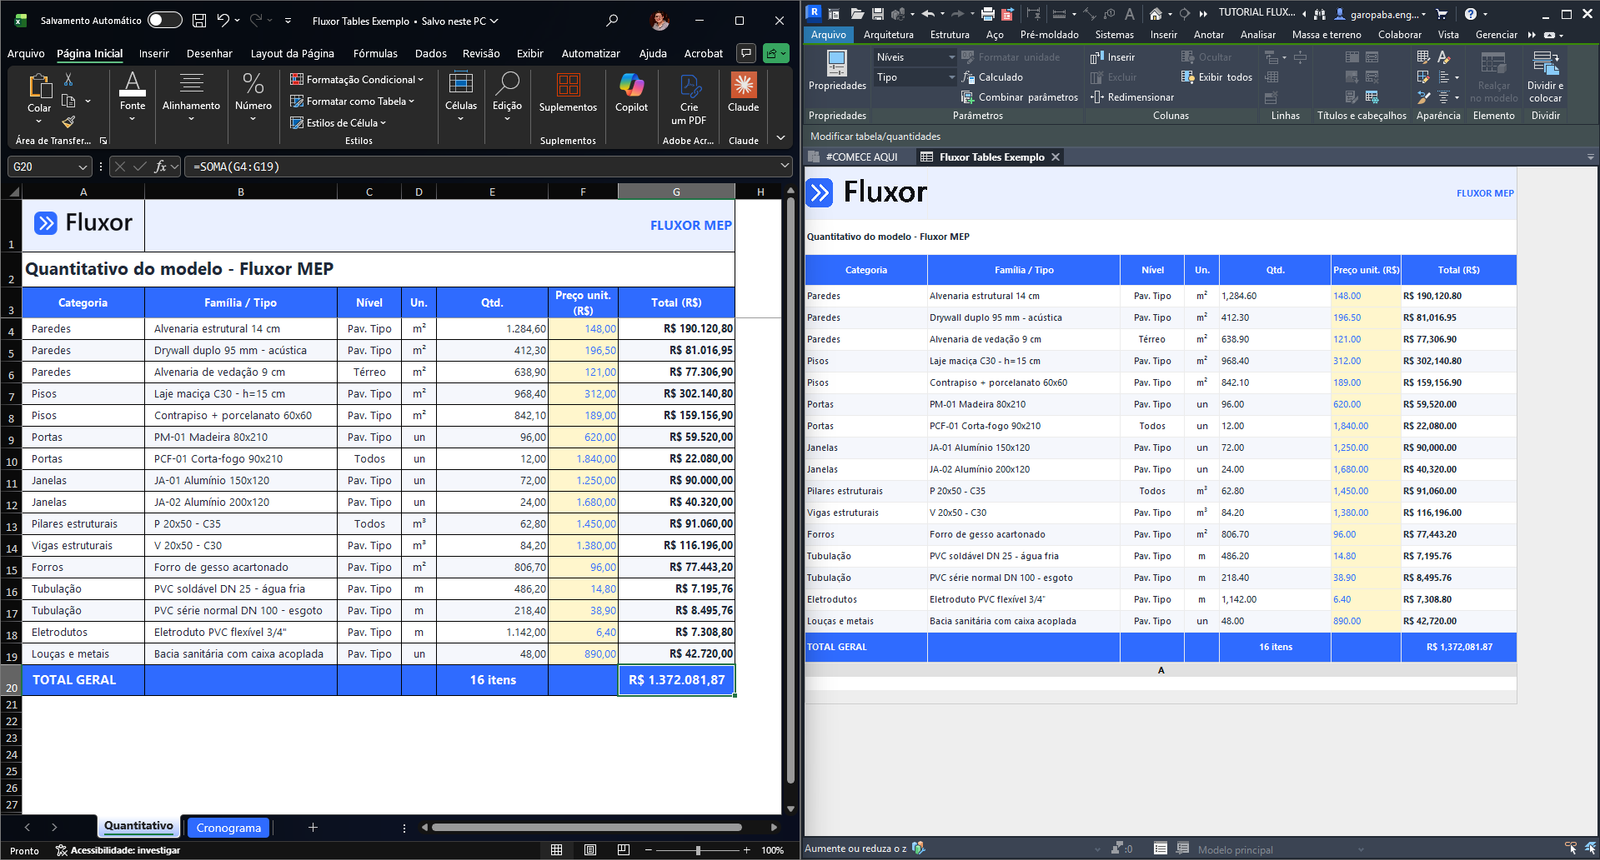
Compare the two sides: structure, colors, merged cells, widths and the logo all came through the same. Numbers come out with a decimal period and left-aligned.
Part 2 — Sync when the spreadsheet changes
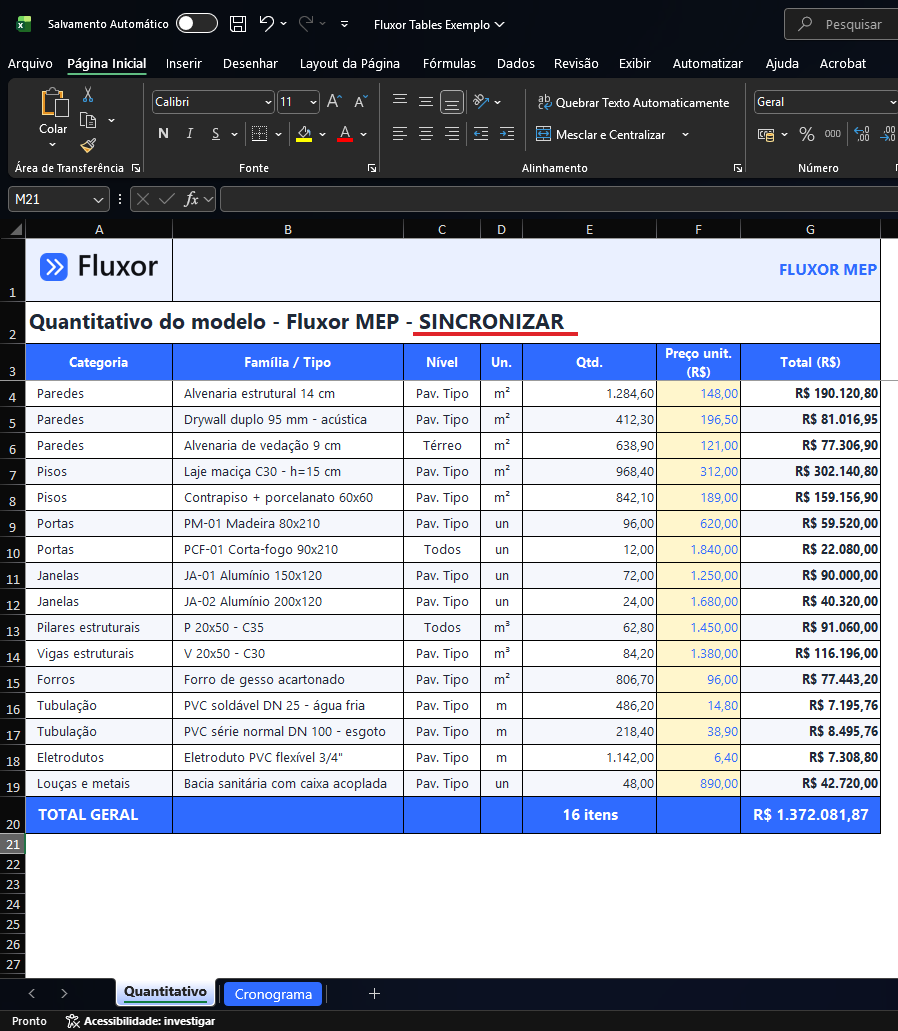
- Edit and save it in Excel. In the example, the title gets - SINCRONIZAR added to it. Save it (Ctrl+S). In Revit, the table still shows the old text — nothing changes on its own.
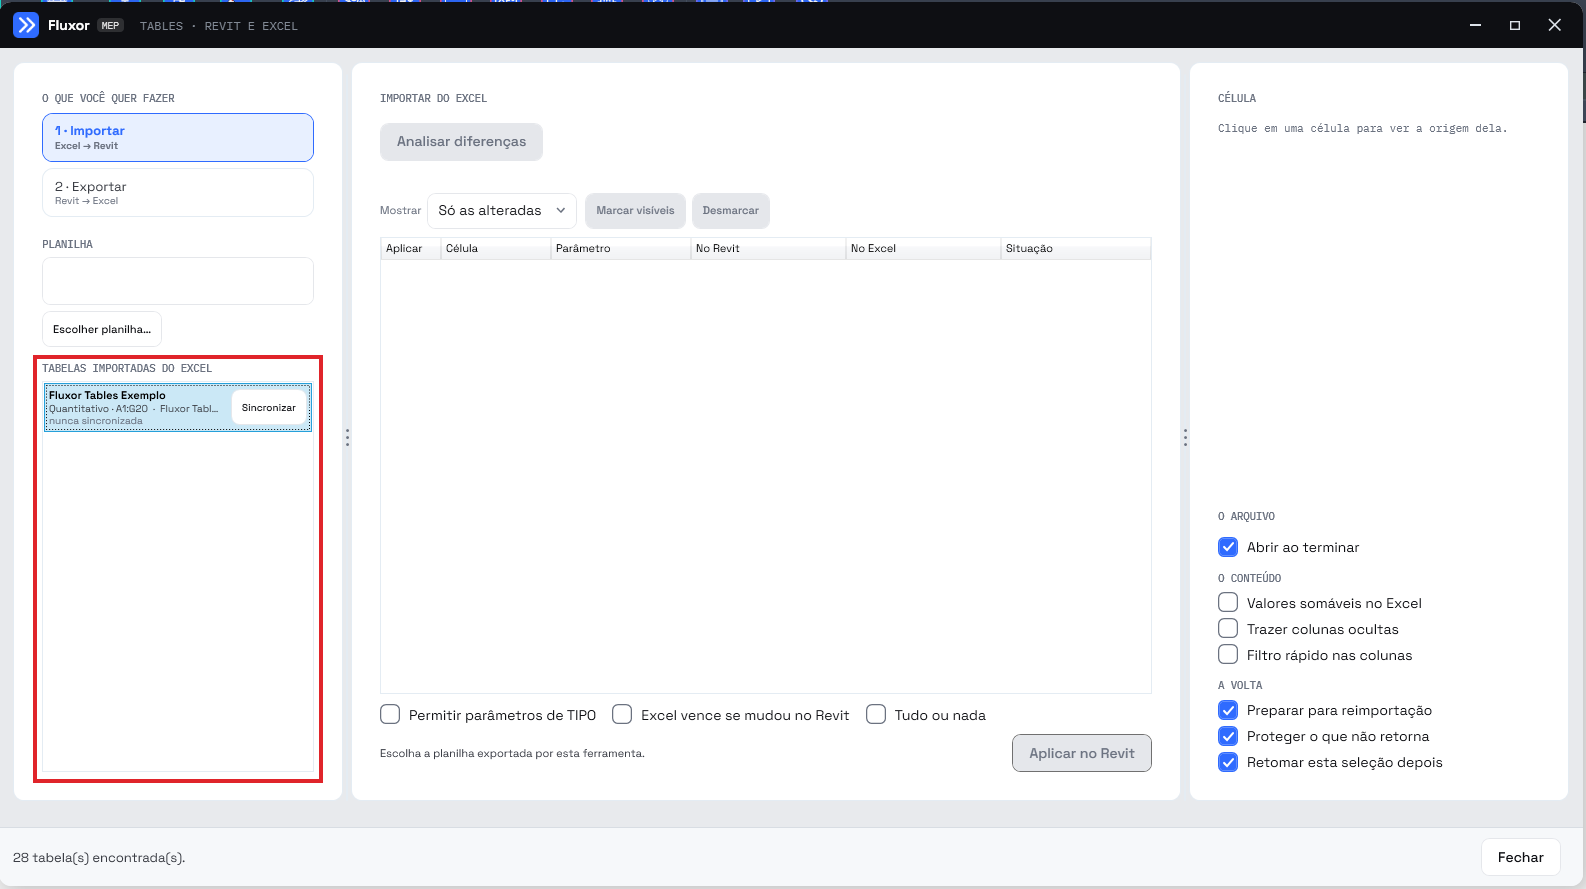
- Click Sync. Open Fluxor Tables. In Import mode, the TABLES IMPORTED FROM EXCEL list shows every table that came from a spreadsheet, with its sheet, region and source file — no need to choose any file. Click Sync on the table's row.
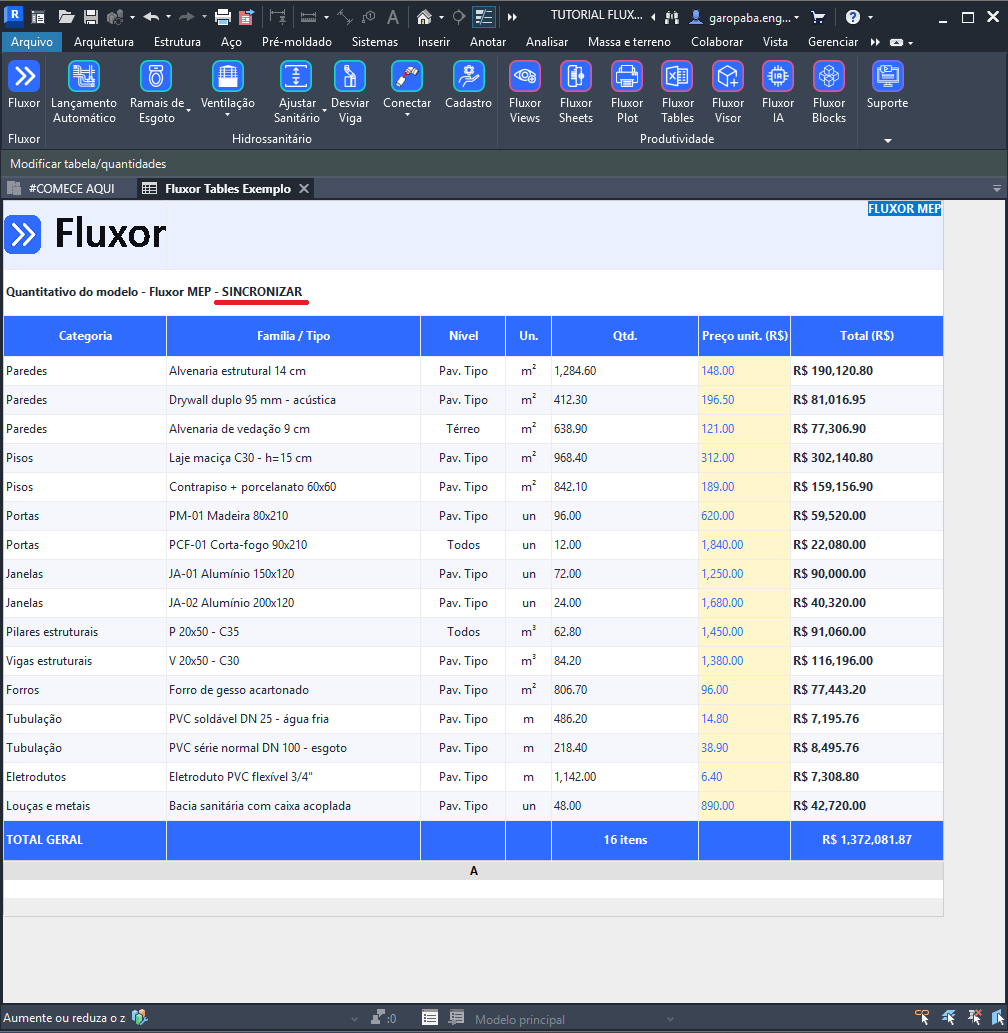
- Done. The table in Revit already shows the spreadsheet's current content. A table that gained rows in Excel comes in whole; one that lost rows shrinks. Ctrl+Z undoes it.
Part 3 — Export tables from Revit to Excel
Each set is an .xlsx file; each sheet inside it is a table. In the example, two files come out: Legenda de Pontos.xlsx, with two material lists, and QD.xlsx, with the panel schedule.
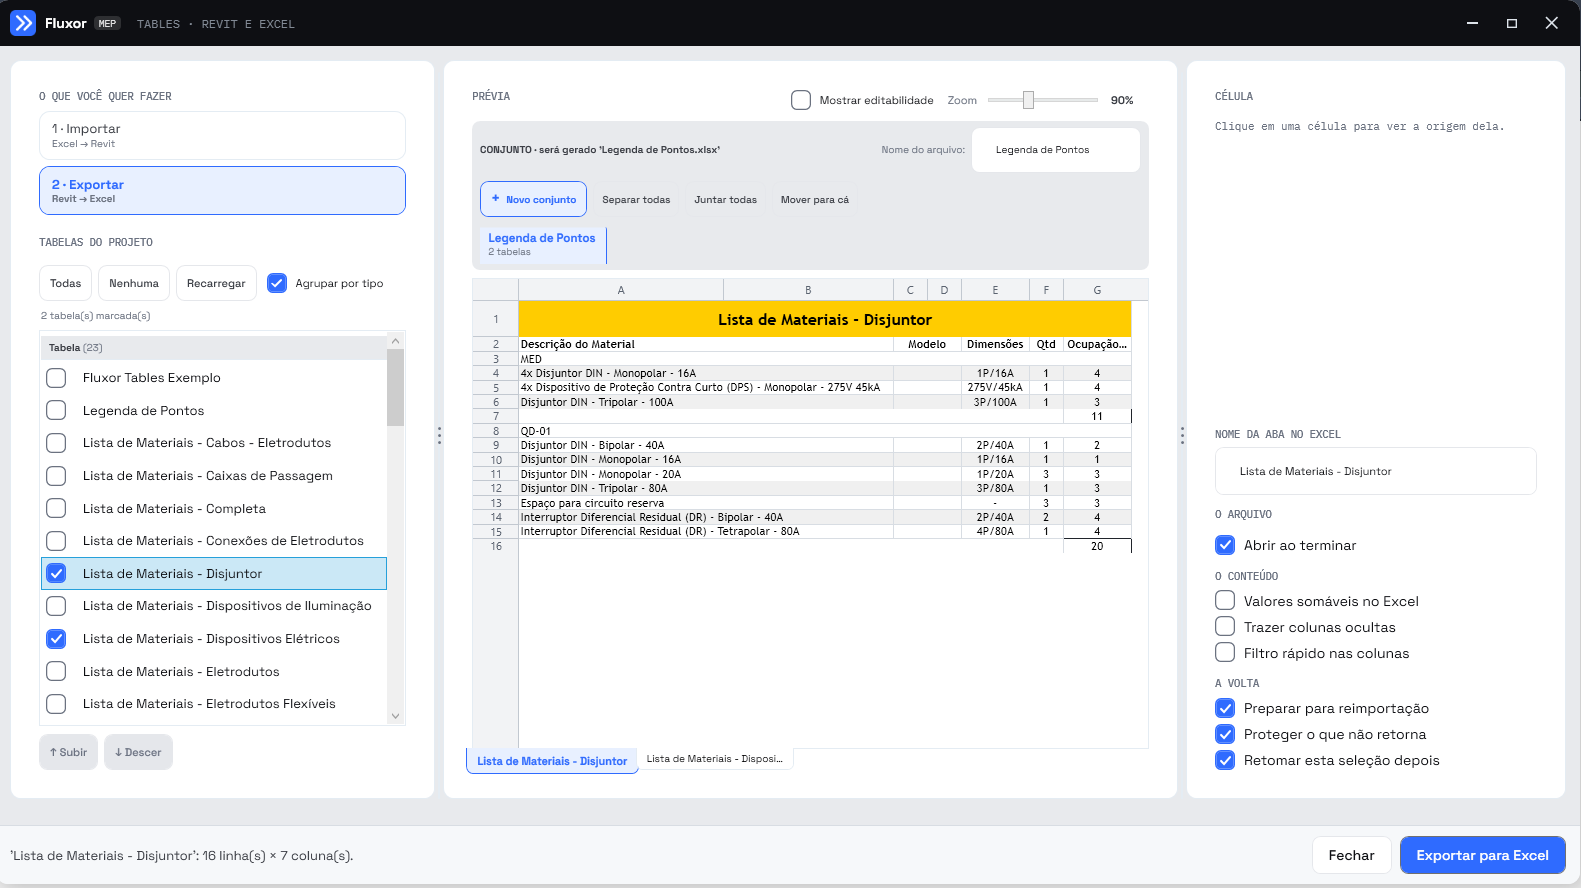
- Check the tables. Click 2 · Export (Revit → Excel). The PROJECT TABLES list brings every table in the model, grouped by type — the panel schedule is under Panel Schedules. Check Lista de Materiais - Disjuntor and Lista de Materiais - Dispositivos Elétricos: each checked table becomes a sheet at the bottom of the preview.
In the image, the three places that matter: the tables in the model (left), the File name field (top) and the selected sheets (bottom). The set already shows renamed to Legenda de Pontos, which is the next step.
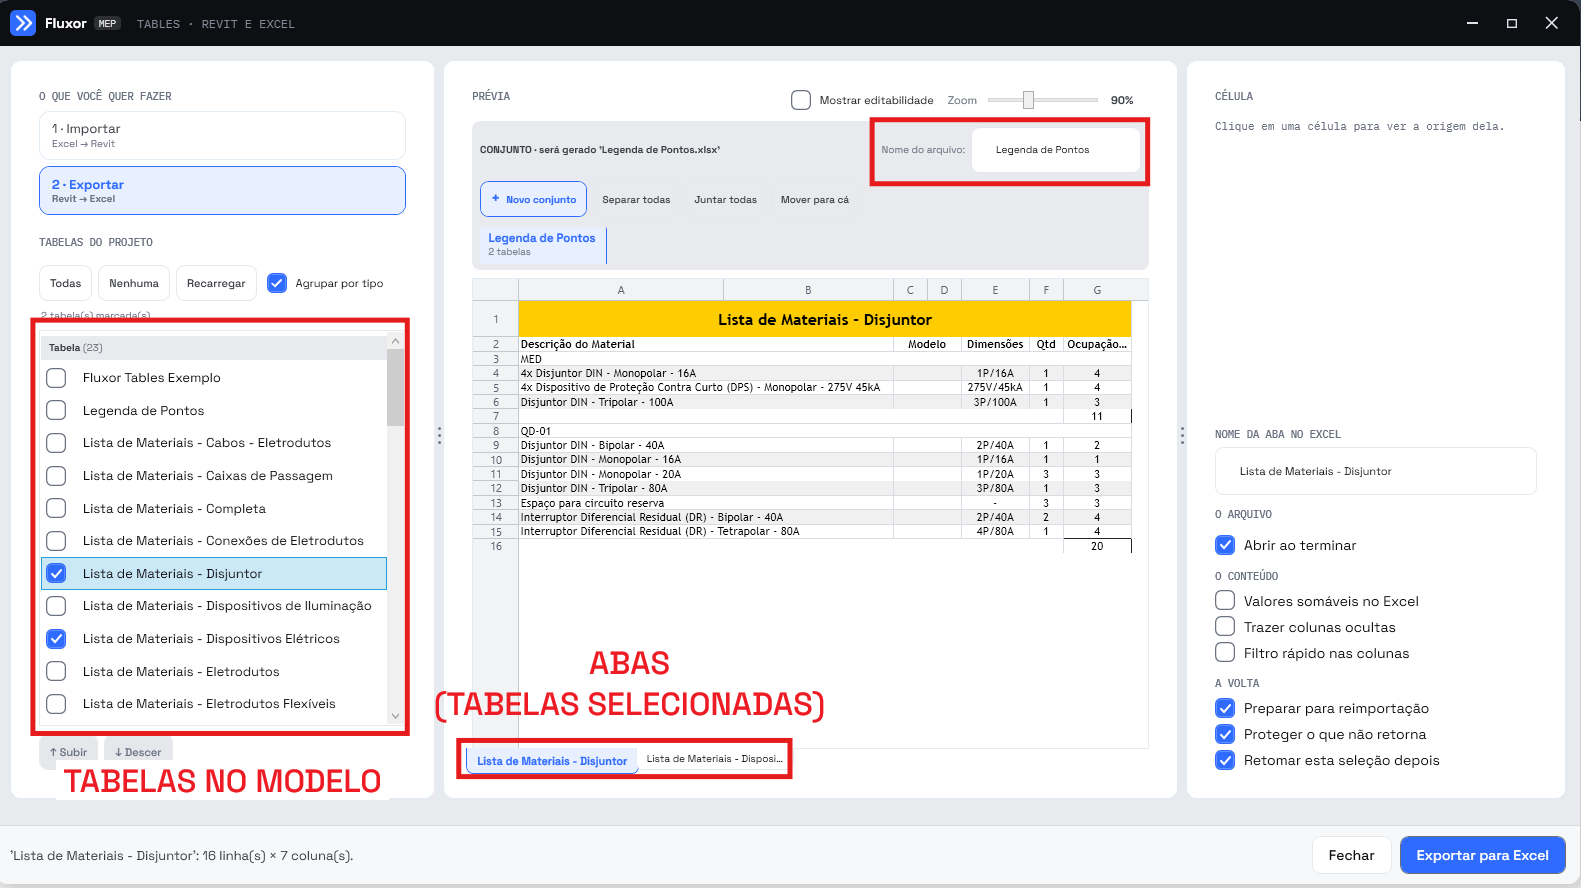
- Name the file. In File name:, type Legenda de Pontos. The header confirms: SET · 'Legenda de Pontos.xlsx' will be generated.
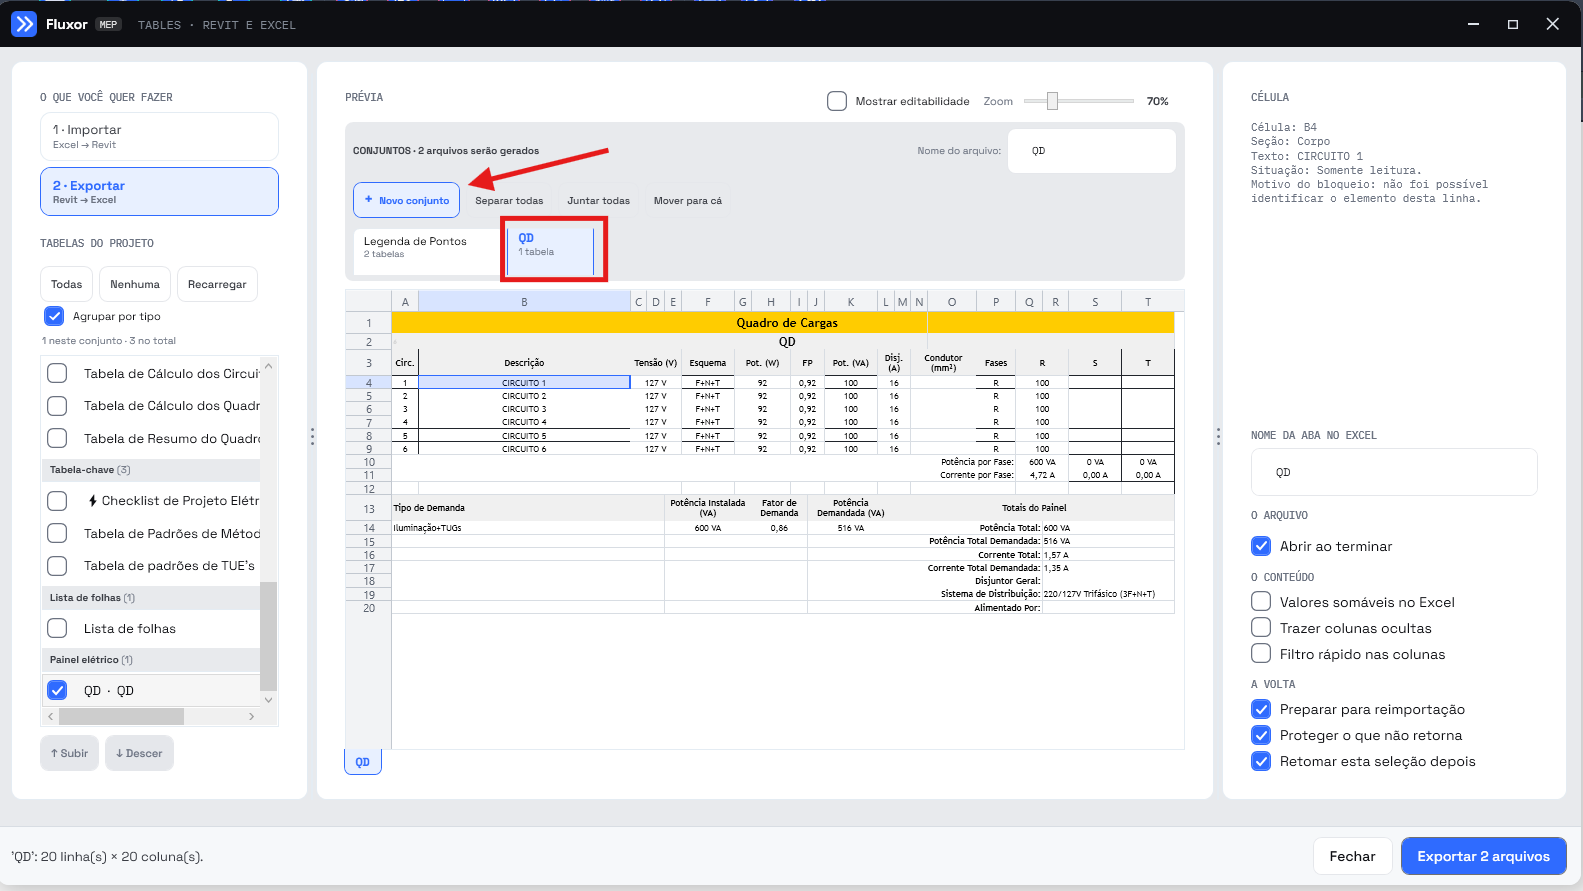
- Create the second file. Click New set. It starts out empty, as Arquivo 2. Check QD · QD under Panel Schedules and rename it to QD. The header switches to SETS · 2 files will be generated and the button at the bottom becomes Export 2 files. Click each set in the strip to see its sheets.
- Export. Click Export 2 files and choose the folder. With a single set, the button reads Export to Excel and asks for the file name. With Open when done on, the folder opens with the finished files.
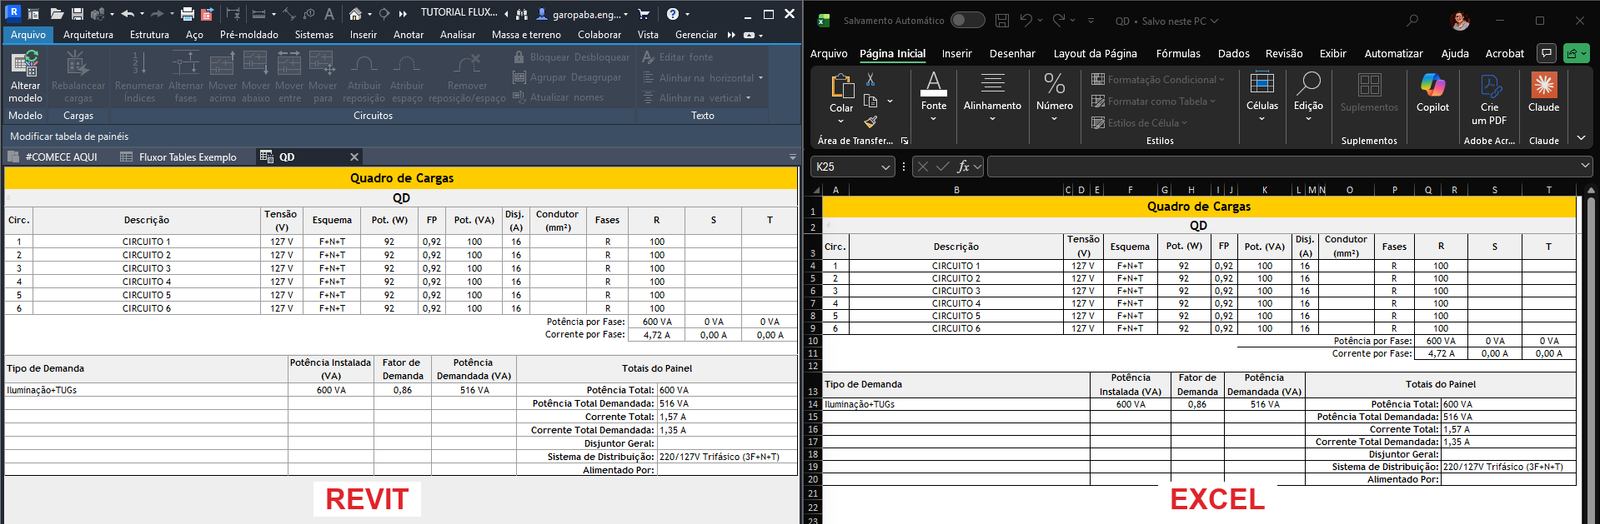
Open QD.xlsx next to the panel in Revit: same title on a yellow strip, same headers, borders and totals. Widths and line breaks may vary a little.
Edit in Excel and bring it back
The exported spreadsheet comes out ready to receive edits and send them back to the model (the Prepare for reimport option, on by default). In Import mode, choose that spreadsheet, click Analyze differences, check the list of what changed, and click Apply to Revit. Only what you check gets written, and Ctrl+Z undoes all of it.
What comes back are the body cells of itemized tables that point to a single element with a writable parameter. Titles, totals, calculated fields, grouped tables and panel schedules are read-only.
Common errors
| Symptom | What to do |
|---|---|
| Greyed-out button on the ribbon | Sign in with your account under Fluxor › Sign in |
| I changed it in Excel and nothing changed in the preview or when syncing | The tool reads the last saved version: Ctrl+S in Excel and try again |
| file not found in the list of imported tables | Click Sync and point to where the spreadsheet is now |
| "The file is open in Excel" on export | Close the file, or export under a different name |
| Numbers don't sum in Excel | Turn on Summable values in Excel before exporting |